


Paid media forecasting is the process of estimating how an advertising campaign will perform before or during its run. A good forecast helps marketers decide how much to spend, where to spend it, what results to expect, and when a campaign is likely to become profitable.
It sounds simple. You estimate your budget, cost per click (CPC), conversion rate, and average order value. Then you calculate expected conversions and revenue.
The problem is that paid advertising does not operate in a fixed environment.
Ad auctions change every day. Competitors can increase their bids. Audience behavior can shift. Creative performance can decline. Landing page conversion rates can move. Automated bidding systems can also change how they allocate your budget based on signals that are not fully visible to advertisers.
That means a forecast should not be treated as a promise. It should be treated as a model of possible outcomes.
A useful paid media forecast starts with a few basic questions:
- How much qualified reach can the budget generate?
- How much traffic can that reach produce?
- How efficiently will that traffic convert?
- How much will each conversion cost?
- How much revenue or pipeline will those conversions create?
- Will the resulting revenue be profitable after advertising and other business costs?
Modern advertising platforms also provide their own forecasting tools. For example, Google Ads Performance Planner can model how changes to budget and bidding targets may affect metrics such as clicks, conversions, conversion value, and cost per acquisition. Its forecasts use recent auction data and account for factors such as seasonality, competitor activity, and conversion delays.
However, platform forecasts should not replace your own business model. A platform may be good at estimating what can happen inside its auction. Your forecasting model must also consider what happens after the click, including conversion quality, customer value, margins, repeat purchases, and overlap with other marketing channels.
The strongest approach is therefore to build a forecast around ranges, assumptions, and scenarios rather than one exact number.
Why Paid Media Forecasts Miss
A paid media forecast usually misses because one or more of its assumptions stops matching reality. The mathematics may be correct, but the inputs can change quickly.
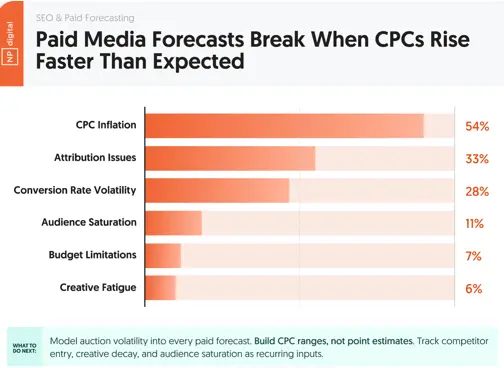
The most common pressure points are CPC inflation, conversion rate volatility, creative decay, automated bidding, and audience overlap.
CPC inflation
CPC is not a fixed cost.
It is influenced by auction competition, demand, audience quality, ad relevance, placement, bidding strategy, and other platform signals. If competitors become more aggressive, the same budget may purchase fewer clicks than your original forecast expected.
For example, imagine a campaign has a $2 average CPC and a $20,000 budget. A simple forecast would expect about 10,000 clicks:
$20,000 ÷ $2 = 10,000 clicks
Now suppose competition pushes the average CPC to $2.50.
The same budget produces only about 8,000 clicks:
$20,000 ÷ $2.50 = 8,000 clicks
That is a 20% reduction in projected traffic without changing the budget.
This is why using one fixed CPC for a long forecast period can create false confidence. Instead, build a CPC range. For example:
- Low-cost scenario: $1.80 CPC
- Base scenario: $2.00 CPC
- High-cost scenario: $2.50 CPC
The resulting reach and conversion forecasts will then show leadership how sensitive the plan is to auction costs.
Google’s current Performance Planner follows a similar principle by using recent auction simulations and adjusting forecasts for factors such as seasonality and competitor activity. Google also recommends more frequent planning when market conditions are unstable.
Conversion rate volatility
Traffic is only useful when it produces the desired action.
A forecast that assumes a constant conversion rate can quickly become inaccurate. Conversion rates can change because of seasonality, pricing, consumer confidence, landing page changes, traffic quality, product availability, promotions, and changes in audience intent.
Consider a campaign that receives 10,000 clicks.
At a 4% conversion rate, it would generate:
10,000 × 4% = 400 conversions
But if the conversion rate falls to 3%, the same traffic produces:
10,000 × 3% = 300 conversions
That 1 percentage-point change reduces conversions by 100.
For this reason, forecasts should separate traffic assumptions from conversion assumptions. Do not simply take last month’s conversion rate and apply it to every future month.
A better model uses historical ranges and adjusts them for known changes. You might forecast a 3% to 4% conversion rate instead of assuming exactly 4%.
The same principle applies to lead-generation campaigns. A cheap lead is not necessarily a good lead. If conversion quality drops, the business may generate more leads while producing less revenue.
Creative decay
Ad creative does not usually perform at the same level forever.
A new ad may initially attract strong attention because the audience has not seen it before. Over time, repeated exposure can reduce engagement. CTR may fall, CPC may rise, and conversion efficiency can weaken.
This creates a problem for forecasts that use the launch period as the benchmark for the entire campaign.
Suppose an ad begins with:
- 2.5% CTR
- $2 CPC
- 4% landing-page conversion rate
If the creative becomes less effective, CTR may decline. The platform may then need more impressions to generate the same number of clicks, while the cost of acquiring those clicks can increase.
Creative decay should therefore be included in the forecast from the beginning.
One practical method is to create a creative-performance curve. Start with historical performance from similar campaigns and estimate how performance changes as an ad ages. If there is no historical data, use conservative assumptions and update them as real campaign data arrives.
The forecast should also include a creative refresh plan. If the model assumes strong performance for six weeks but the team has no plan to introduce new creative, the forecast is internally inconsistent.
AI bidding unpredictability
Automated bidding has changed the way paid campaigns behave.
Platforms increasingly use machine learning to decide which users to target, which auctions to enter, how aggressively to bid, and how to distribute budget. This can improve performance, but it also makes simple forecasting harder.
Advertisers have less direct control over individual bids than they did with older manual approaches.
That means a marketer cannot always assume that increasing or decreasing a bid by a certain percentage will produce a predictable change in traffic.
Automated systems also need enough useful signals to make good decisions. A new campaign with limited conversion data can behave very differently from an established campaign with a large historical data set.
The practical response is not to avoid automated bidding. Instead, forecasts should include uncertainty around the results.
Use scenario ranges for:
- CPC or CPM
- conversion volume
- CPA
- ROAS
- spend utilization
- time to reach stable performance
Platform forecasts can be useful inputs, but they should be combined with your own historical data and business assumptions.
Audience overlap across platforms
Another common forecasting mistake is adding the projected reach of each platform together as if every impression reaches a different person.
Imagine a company forecasts:
- 500,000 people reached through paid search
- 400,000 people reached through paid social
- 300,000 people reached through display
A simple model might report 1.2 million people reached.
But the same person can interact with multiple channels.
Someone might first see a social ad, later search for the brand on Google, and finally convert after clicking a search ad. Each platform can report part of that journey, but the business still has one customer.
This creates two problems.
First, total reach may be overstated.
Second, attributed conversions may make individual channels look more effective than they really are.
A strong forecast therefore distinguishes between platform-attributed performance and incremental business impact.
When possible, use experiments, geographic tests, holdout groups, attribution analysis, or other incrementality methods to estimate how much additional demand the paid activity actually creates.
The Ramp-Up Curve: Why New Campaigns Run Negative First
New paid campaigns often look worse at launch than they do after they mature.
This is one of the most important concepts to include in a paid media forecast.
A new campaign starts without the same amount of historical information as an established campaign. Automated systems need time to gather signals, test audiences, evaluate creative, and identify users who are more likely to complete the desired action.
As a result, early performance can be unstable.
CPC may be higher than the eventual average. Conversion rates may be lower. The campaign may spend money while the system gathers information.
This creates a ramp-up curve.
Instead of forecasting a campaign with one average CPA from day one, break the forecast into stages.
For example:
| Period | Expected behavior |
|---|---|
| Week 1 | High uncertainty and data collection |
| Weeks 2–3 | Early optimization and audience learning |
| Weeks 4–5 | More stable traffic and conversion patterns |
| Week 6+ | Closer to expected steady-state performance |
The exact timeline will vary by platform, budget, conversion volume, audience size, and campaign type. Performance Max and other broad, automation-heavy campaigns can behave differently from tightly controlled search campaigns.
The key point is that launch performance should not automatically be treated as steady-state performance.
A campaign can be unprofitable during its first few weeks and still become profitable later.
For example, suppose a campaign has this projected contribution:
- Week 1: -$4,000
- Week 2: -$2,000
- Week 3: -$500
- Week 4: +$1,000
- Week 5: +$2,500
- Week 6: +$3,500
The campaign may look like a failure if leadership only sees the first two weeks. But the full forecast shows a planned path toward profitability.
This is why forecasts should show week-by-week performance, especially for new campaigns.
A flat campaign average hides important information. It can make early losses look smaller than they are while making later performance look less meaningful.
The forecast should clearly separate:
- Ramp-up performance
- Learning and stabilization
- Steady-state performance
This also creates better decision rules.
For example, instead of saying, “The campaign must reach a 3x ROAS immediately,” a team might establish milestones such as:
- Week 1: validate tracking and traffic quality
- Week 2: evaluate early conversion signals
- Week 3: identify creative and audience winners
- Week 4: compare actual performance with the forecast range
- Week 6+: evaluate steady-state efficiency
This approach gives algorithms time to learn while still protecting the budget from uncontrolled losses.
The Three-Step Paid Forecasting Framework
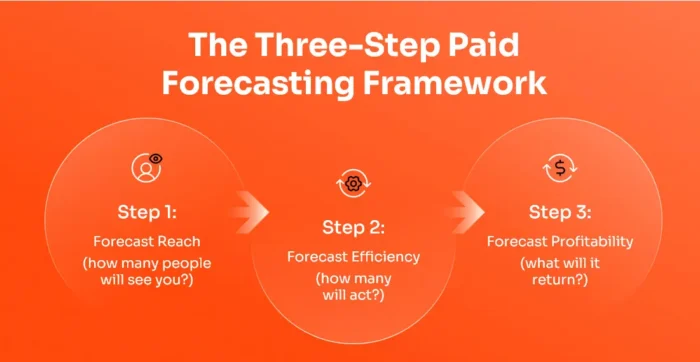
A reliable paid media forecast should be built in sequence.
Start with reach. Then estimate efficiency. Finally, calculate profitability.
This order matters because each step depends on the previous one.
You cannot reliably forecast profit if you do not know how much qualified traffic the budget can generate. You cannot forecast conversions without estimating the traffic volume and conversion efficiency.
The basic flow is:
Budget → Reach → Traffic → Conversions → Revenue → Profit
Step 1: Forecast Reach
The first question is:
How much qualified exposure can this budget realistically buy?
Your reach forecast should consider factors such as:
- Total budget
- Target audience size
- Campaign type
- Platform
- CPM or CPC
- Expected impression volume
- Expected impression share where applicable
- Frequency
- Geography
- Seasonality
- Competition
For a CPC-based campaign, a simple starting calculation is:
Estimated clicks = Budget ÷ Expected CPC
For a CPM-based campaign:
Estimated impressions = (Budget ÷ CPM) × 1,000
These formulas are useful, but they should not be treated as exact predictions.
Suppose the budget is $50,000 and expected CPM is $10:
($50,000 ÷ $10) × 1,000 = 5 million impressions
That does not mean the campaign will definitely produce five million impressions. The actual result can change as auction conditions, targeting, creative quality, and delivery change.
For this reason, use a range.
For example:
- Conservative: $12 CPM → about 4.17 million impressions
- Base: $10 CPM → 5 million impressions
- Optimistic: $8 CPM → 6.25 million impressions
The same approach works for CPC.
Reach should also account for frequency. Reaching the same user repeatedly is not equivalent to reaching new users.
If a campaign generates 1 million impressions but average frequency is 5, its approximate unique reach is much closer to:
1,000,000 ÷ 5 = 200,000 people
This distinction becomes especially important when a campaign has a limited audience.
Google’s current forecasting tools also model the effects of changing spend and campaign settings rather than treating a single historical performance number as a guaranteed result.
The output of Step 1 should therefore include a range for:
- Impressions
- Reach
- Frequency
- Clicks, when appropriate
- Estimated CPC or CPM
Step 2: Forecast Efficiency
Once you have an estimate of reach and traffic, determine how efficiently that traffic is likely to perform.
This stage connects media exposure with business actions.
Key inputs include:
- Historical CTR
- Creative performance
- Audience segment
- Landing-page conversion rate
- Lead-to-opportunity rate
- Purchase conversion rate
- Seasonal behavior
- Traffic quality
- Expected creative decay
A basic conversion forecast is:
Estimated conversions = Estimated clicks × Conversion rate
For example, if your forecast produces 20,000 clicks and you expect a 3% conversion rate:
20,000 × 3% = 600 conversions
You can then calculate expected CPA:
CPA = Advertising spend ÷ Conversions
If the campaign spends $30,000 to generate 600 conversions:
$30,000 ÷ 600 = $50 CPA
But again, one fixed conversion rate is often too optimistic.
Instead, model several scenarios:
| Scenario | Clicks | Conversion rate | Conversions |
|---|---|---|---|
| Conservative | 20,000 | 2.5% | 500 |
| Base | 20,000 | 3.0% | 600 |
| Optimistic | 20,000 | 3.5% | 700 |
This makes the forecast much more useful for decision-making.
Creative decay should also be included here. If CTR or conversion rates normally decline as an ad ages, reduce the efficiency assumption over time rather than keeping launch performance constant.
Historical data is the best starting point. Look at performance by:
- Creative type
- Audience
- Placement
- Device
- Geography
- Campaign objective
- Funnel stage
The goal is not to create unnecessary complexity. It is to avoid mixing very different traffic sources into one average that hides meaningful differences.
Step 3: Forecast Profitability
The final step asks the question leadership usually cares about most:
What will the business get back from the advertising investment?
Start with your forecasted conversions and connect them to revenue or pipeline.
For ecommerce, a simple revenue estimate is:
Revenue = Conversions × Average Order Value
For example:
- 600 purchases
- $120 average order value
Estimated revenue:
600 × $120 = $72,000
If advertising spend is $30,000:
ROAS = $72,000 ÷ $30,000 = 2.4x
But ROAS alone does not tell you whether the campaign is profitable.
A business with a 2.4x ROAS and a 30% contribution margin may lose money, while another business with a 2.4x ROAS and a much higher margin may be profitable.
Therefore, profitability forecasts should consider:
- Advertising spend
- Revenue
- Average order value
- Gross margin
- Contribution margin
- Customer acquisition cost
- Customer lifetime value
- Refunds or cancellations
- Discounts
- Sales costs
- Payback period
For lead generation, the calculation needs another layer.
Suppose paid media generates 1,000 leads. If 10% become qualified opportunities and 20% of those opportunities close, the forecast produces:
1,000 × 10% × 20% = 20 customers
If the average gross contribution per customer is $2,000, the expected contribution is:
20 × $2,000 = $40,000
That figure is more useful than simply reporting the number of leads.
Finally, adjust the profitability forecast for incrementality.
A platform may attribute a conversion to an ad even when that customer would have purchased without the ad. Branded search is a common example. A user may already intend to buy, click a branded ad, and then become attributed revenue for that campaign.
Your forecast should therefore distinguish between:
Attributed revenue — revenue credited to the paid channel.
Incremental revenue — revenue that would not have happened without the paid activity.
The second number is closer to the true business impact.
The final forecasting chain should look like this:
Budget → Reach → Traffic → Conversions → Customers → Revenue → Incremental Revenue → Contribution → Profitability
This sequence creates a more realistic model because every financial assumption can be traced back to a media assumption.
Most importantly, do not present the forecast as one guaranteed number. Use a base case plus conservative and optimistic scenarios. That gives decision-makers a clearer view of both the opportunity and the risk.
The Forecast Models That Hold Up Under Pressure
A basic paid media forecast often starts with historical averages. You take the previous CPC, conversion rate, CAC, and ROAS, then apply those numbers to the next budget period.
That approach can work when conditions remain stable.
Paid media rarely stays stable for long.
Auction competition changes. Creative performance declines. Customer behavior shifts. New campaigns need time to learn. Multiple platforms may target the same people. A budget increase can also produce weaker returns once a campaign reaches the limits of its most valuable audience.
For these reasons, stronger forecasting models look beyond simple averages. Four models are especially useful when you need a forecast that can handle changing conditions: cohort-based forecasting, blended CAC modeling, incrementality-adjusted forecasting, and spend elasticity modeling.
Cohort-based forecasting
Cohort-based forecasting groups customers or conversions by when they were acquired. Instead of treating all customers as one group, you track each acquisition cohort as it moves through the customer journey.
For example, you might create cohorts based on:
- Acquisition week
- Acquisition month
- Campaign launch date
- Paid channel
- Customer segment
- Product purchased
- First-order value
This gives you a better view of how customers behave after acquisition.
Suppose a paid campaign acquired 500 customers in January. Those customers may generate additional purchases in February, March, and later months. A February cohort may behave differently because it was acquired during a different promotion or through different creative.
A simple monthly report can hide these differences. Cohort analysis exposes them.
This matters for forecasting because revenue does not always happen in the same period as acquisition.
A campaign could generate customers at a $100 CAC. If each customer produces only $80 of first-month revenue, the campaign may appear unprofitable at first. But if those customers generate another $150 over the following months, the economics look very different.
A cohort model can therefore connect:
Acquisition → First purchase → Repeat purchase → Customer value → Payback
It also helps prevent recency bias.
Recent campaigns often have incomplete revenue histories. An older cohort has had more time to produce repeat purchases, while a newer cohort has not. Comparing them using total revenue alone can make new campaigns appear worse than they actually are.
For paid media forecasting, cohort models are particularly useful when:
- Customers make repeat purchases.
- Sales cycles extend beyond the acquisition month.
- Lead-to-customer conversion takes time.
- Customer lifetime value is important.
- Campaigns have different launch dates.
- You are scaling spend and need to understand customer quality.
The model can become more useful when you combine acquisition cohorts with campaign or channel data. You can then identify whether customers from paid search, paid social, or another channel produce different long-term value.
This gives you a more realistic forecast than simply assuming that every new customer will produce the same revenue.
Blended CAC modeling
Customer acquisition cost is often reported by channel.
You might see:
- Paid search CAC: $70
- Paid social CAC: $85
- Display CAC: $110
That information is useful, but it can become misleading when channels overlap.
The same customer may interact with several campaigns before converting. A person might see a social ad, visit the website, search for the brand, click a paid search ad, and then purchase.
Each platform may claim some level of credit for the conversion.
If you optimize every channel independently, you can end up moving budget toward channels that appear efficient because of attribution rather than because they are generating truly additional customers.
Blended CAC takes a wider view.
The basic formula is:
Blended CAC = Total Marketing and Sales Acquisition Spend ÷ Total New Customers Acquired
For example, suppose a company spends:
- $40,000 on paid search
- $30,000 on paid social
- $10,000 on display
Total acquisition spend is $80,000.
If the business acquires 1,000 new customers, blended CAC is:
$80,000 ÷ 1,000 = $80
This number does not tell you which platform deserves every dollar. Instead, it tells you what the overall acquisition system is costing the business.
That distinction becomes important when forecasting a budget increase.
Suppose paid social reports a $65 CAC at the current spend level. You might assume that doubling its budget will produce twice as many customers at the same CAC.
That is rarely a safe assumption.
The additional budget may reach less responsive audiences. Frequency may rise. Competition may increase. Creative fatigue may become stronger. As a result, marginal CAC can rise even while reported average CAC remains attractive.
A blended model helps leadership see the impact of the entire paid acquisition system rather than isolated platform metrics.
It also creates a useful bridge between marketing forecasts and financial planning.
Instead of saying:
“We expect paid social to generate 2,000 conversions.”
You can say:
“We expect the additional investment to increase total customer acquisition while keeping blended CAC within the company’s target range.”
That is much closer to the question leadership needs answered.
Incrementality-adjusted forecasting
Attribution tells you which channel received credit for a conversion.
Incrementality asks a different question:
Would that conversion have happened without the advertising?
This distinction is critical.
Some paid campaigns capture demand that already exists. Branded search and retargeting are common examples. A customer may already intend to purchase, but the advertising platform receives credit after the person clicks an ad.
If your forecast treats every attributed conversion as incremental, it can overstate the true value of paid media.
Incrementality-adjusted forecasting attempts to correct this problem.
A simplified calculation is:
Incremental conversions = Attributed conversions × Incrementality rate
Suppose a campaign is expected to produce 1,000 attributed conversions. If testing suggests that 70% are incremental:
1,000 × 70% = 700 incremental conversions
The forecast should then use the 700 incremental conversions when estimating the true business impact.
The incrementality rate should not be guessed when reliable testing data is available. It can be informed by:
- Holdout experiments
- Geographic tests
- Conversion lift studies
- Matched-market experiments
- Platform experiments
- Historical test results
The exact method depends on the channel, available data, and business model.
Incrementality is especially important when multiple channels operate at the same time. Without an adjustment, you can accidentally count the same demand more than once.
It also changes how you evaluate budget increases.
Imagine a retargeting campaign reports a 6x ROAS. That sounds excellent. But if most of those customers would have converted anyway, the incremental ROAS may be much lower.
An incrementality-adjusted forecast asks what happens to total business results when the budget changes.
That makes it more useful for investment decisions.
Spend elasticity modeling
Spend elasticity modeling answers one of the hardest questions in paid media:
What happens if we spend more?
Many forecasts assume a linear relationship.
If $50,000 produces 500 conversions, the model assumes $100,000 will produce 1,000 conversions.
That assumption is often wrong.
Paid campaigns generally face diminishing returns as spend increases. The first dollars may reach the highest-value opportunities. Additional dollars eventually reach people who are less likely to convert or require more exposure.
This means marginal performance can deteriorate as spend rises.
For example:
| Monthly Spend | Conversions | CAC |
|---|---|---|
| $20,000 | 300 | $67 |
| $40,000 | 550 | $73 |
| $60,000 | 750 | $80 |
| $80,000 | 900 | $89 |
| $100,000 | 1,000 | $100 |
The campaign is still generating more customers as spend increases. However, each additional group of customers costs more to acquire.
That is the basic idea behind spend elasticity.
A useful model compares marginal spend with marginal output.
You might ask:
- How many additional conversions come from the next $10,000?
- How much does marginal CAC increase?
- At what spend level does ROAS fall below the target?
- How much additional revenue is truly incremental?
- Does the extra volume justify the lower efficiency?
This model is particularly valuable during budget planning.
If leadership asks whether the company should increase monthly paid spend from $100,000 to $200,000, the answer should not come from simply doubling the current forecast.
Instead, model several spend levels and estimate how efficiency changes at each level.
The result may show that the first $100,000 is highly efficient, the next $50,000 remains attractive, and the final $50,000 produces significantly weaker returns.
That creates a much stronger budget recommendation.
Building a Paid Forecast Leadership Will Trust
Leadership rarely expects a paid media forecast to predict the future perfectly.
What leadership needs is a forecast that explains what is likely to happen, what could change the outcome, and what the marketing team will do when conditions change.
Trust comes from transparency.
Start by showing the assumptions behind the forecast. These may include:
- Planned spend
- Expected CPC or CPM
- Expected CTR
- Conversion rate
- Customer acquisition cost
- Average order value
- Customer lifetime value
- Creative refresh rate
- Seasonality
- Expected audience size
- Incrementality assumptions
- Conversion delay
Do not hide these assumptions inside a spreadsheet.
If CPC rises by 20%, leadership should be able to see how that affects clicks, conversions, CAC, and revenue.
The same should be true for conversion rates.
A forecast can use three scenarios:
Conservative case
This represents a weaker market or campaign outcome.
For example:
- CPC rises
- Conversion rate declines
- Creative decays faster
- Incrementality is lower
- Marginal CAC increases faster
Base case
This represents the most likely outcome based on current performance and historical data.
It should be the central planning scenario, not an overly optimistic target.
Upside case
This assumes stronger conditions.
For example:
- CPC remains stable
- Creative performs above expectations
- Conversion rates improve
- Demand increases
- New creative produces stronger engagement
The important point is that each scenario should have clear assumptions.
Do not create three numbers simply to make a presentation look complete.
Leadership should be able to ask, “What would need to happen for us to move from the base case to the downside case?” and receive a clear answer.
Forecasts should also connect directly to business metrics.
Executives generally care more about revenue, profit, pipeline, customer acquisition, and payback than clicks or impressions.
That does not make media metrics unimportant. They are the leading indicators that explain why business results are changing.
A useful reporting chain is:
Spend → Reach → Clicks → Conversions → Customers → Revenue → Contribution → Profit
This structure makes the forecast easier to understand and easier to challenge.
Forecast accuracy should also be reviewed regularly.
When actual results differ from the forecast, do not simply label the forecast “wrong.”
Identify the source of the variance.
For example:
Forecast CPC: $2.00
Actual CPC: $2.40
The next question is why.
Was competition stronger? Did the audience change? Did creative performance decline? Did the campaign move into more expensive inventory?
The same process should be applied to conversion rate, conversion volume, CAC, revenue, and other major inputs.
This turns forecasting into a learning system.
The model becomes better because every forecast-versus-actual comparison improves the assumptions used in the next forecast.
The 90-Day Paid Forecasting Action Plan
A reliable forecasting system does not need to be built in one week.
A 90-day process gives the marketing team enough time to clean its data, build useful models, test assumptions, and connect forecasting to regular planning.
Days 1 to 30: Clean Your Inputs
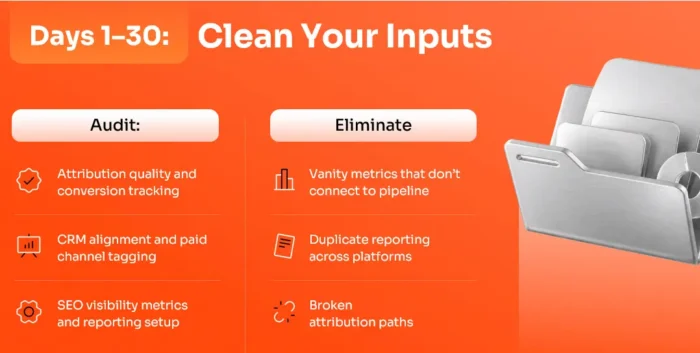
The first month should focus on data quality.
Start by auditing every major paid media input.
Check whether:
- Conversion tracking is working.
- Primary conversion actions are correctly defined.
- Duplicate conversions are removed.
- Revenue values are accurate.
- CRM stages match marketing reporting.
- Campaign names are consistent.
- UTM parameters are reliable.
- Offline conversions are being captured where appropriate.
- Conversion windows are understood.
- Attribution settings are documented.
Pay special attention to conversion delay.
A customer may click an advertisement today but convert several days later. If the forecast compares recent clicks with incomplete conversion data, the campaign can appear weaker than it really is.
Current Google forecasting systems account for conversion delays in certain campaign forecasts, which shows why timing needs to be considered when evaluating actuals against projections.
Next, collect historical performance data.
At minimum, gather:
- Spend
- Impressions
- Clicks
- CPC
- CTR
- Conversions
- Conversion rate
- CAC
- Revenue
- ROAS
- Customer count
Where possible, break these numbers down by campaign, audience, creative, geography, and acquisition cohort.
Finally, document the current forecasting process.
Write down where each number comes from and who owns it.
The goal of the first 30 days is simple:
Do not build a sophisticated model on unreliable data.
Days 31 to 60: Build Your Models
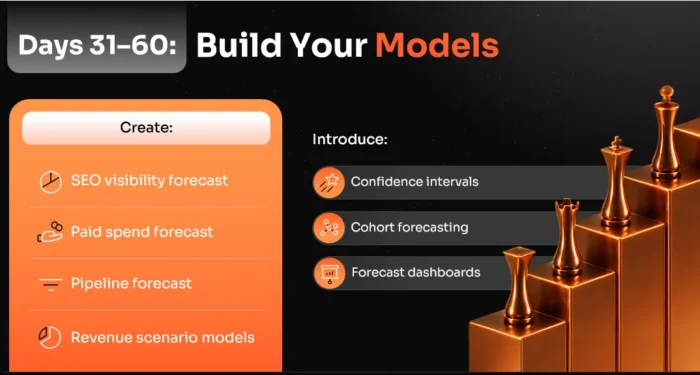
Once the inputs are clean, build the forecasting models.
Start with the three-step structure:
Reach → Efficiency → Profitability
Then add the four models where they are relevant:
- Cohort-based forecasting
- Blended CAC modeling
- Incrementality-adjusted forecasting
- Spend elasticity modeling
Build at least three forecast scenarios.
The model should allow you to change important assumptions without rebuilding the entire spreadsheet.
For example, a CPC change should automatically update:
- Estimated clicks
- Conversions
- CAC
- Revenue
- ROAS
- Profit contribution
Do the same for conversion rate, spend, average order value, and other major variables.
You should also build a forecast-versus-actuals view.
This dashboard should show:
| Metric | Forecast | Actual | Variance |
|---|---|---|---|
| Spend | $100K | $105K | +5% |
| CPC | $2.00 | $2.20 | +10% |
| Conversions | 2,000 | 1,850 | -7.5% |
| CAC | $50 | $56.76 | +13.5% |
| Revenue | $240K | $225K | -6.3% |
The exact metrics will depend on the business model.
The purpose is to make variance visible.
For platform-specific planning, use native forecasting tools as supporting evidence rather than treating them as the complete business forecast. Search Ads 360’s current Plans feature uses historical campaign and conversion data to project performance and allows scenario adjustments, including seasonality and custom conversion rates.
Days 61 to 90: Make It Operational
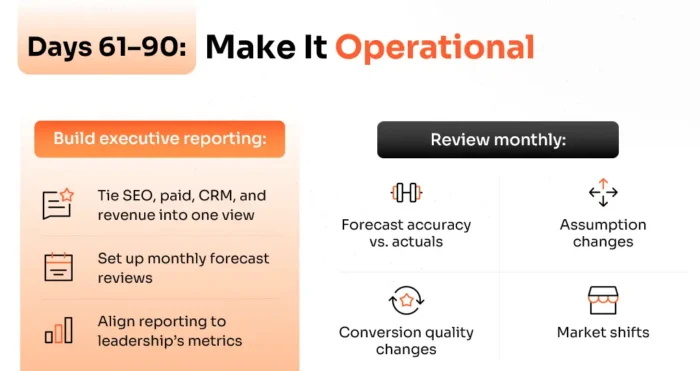
The final month turns the forecast into a recurring business process.
Set a regular review schedule.
A weekly review can focus on leading indicators such as:
- Spend
- CPC
- CPM
- CTR
- Conversion rate
- Conversion volume
- Creative performance
A monthly review can focus on:
- CAC
- Revenue
- ROAS
- Incrementality
- Customer quality
- Cohort performance
- Forecast accuracy
A quarterly review can focus on:
- Budget allocation
- Spend elasticity
- Channel mix
- Customer lifetime value
- Long-term profitability
Create clear thresholds that trigger action.
For example:
- CPC more than 15% above forecast → investigate auction pressure.
- Conversion rate more than 15% below forecast → investigate traffic quality and landing pages.
- Creative CTR falls below the replacement threshold → launch new creative.
- CAC exceeds the target range → review channel mix and marginal spend.
- Revenue falls below forecast despite stable media metrics → investigate customer quality or sales conversion.
The exact thresholds should match your historical volatility.
The goal is not to react to every small change. It is to identify meaningful deviations early enough to act.
By the end of 90 days, forecasting should no longer be a spreadsheet created before a budget meeting.
It should be part of the operating rhythm.
FAQs
How do you forecast marketing results?
Start with historical performance and clearly defined business goals. Forecast reach first, then efficiency, and finally profitability.
Estimate how much exposure the budget can generate. Then model clicks, conversions, customers, and CAC. Finally, connect those results to revenue, contribution margin, and profitability.
Use conservative, base, and upside scenarios instead of one fixed number. Include factors such as CPC changes, conversion-rate volatility, creative decay, seasonality, audience overlap, and incrementality.
The forecast should also be updated as actual campaign data becomes available.
How do you forecast performance against actuals?
Create a forecast before the campaign or reporting period begins, then compare the forecast with actual results at regular intervals.
Track both the numerical variance and the reason behind it.
For example:
Forecast CPC: $2.00
Actual CPC: $2.30
Variance: +15%
Then investigate the cause.
You can repeat this process for:
- Spend
- Reach
- Clicks
- CPC
- Conversion rate
- Conversions
- CAC
- Revenue
- ROAS
Do not only measure whether the forecast was right or wrong. Identify which assumption caused the difference.
This creates a feedback loop that improves future forecasts.
How do you make a sales forecast in a marketing plan?
Start with expected marketing-generated demand and connect it to the sales funnel.
For example:
Ad spend → Leads → Qualified leads → Opportunities → Customers → Revenue
If you expect 10,000 leads, a 10% qualification rate, and a 20% close rate:
10,000 × 10% × 20% = 200 customers
If the average customer generates $2,000 in revenue:
200 × $2,000 = $400,000 projected revenue
The model should also include sales-cycle timing, conversion delays, customer quality, and historical close rates.
For paid media, it is useful to compare this forecast with blended CAC and incremental revenue rather than relying only on platform-attributed conversions.
What is a marketing forecast?
A marketing forecast is an estimate of future marketing performance based on historical data, planned spending, market conditions, and stated assumptions.
It can forecast metrics such as:
- Reach
- Traffic
- Leads
- Customers
- CAC
- Revenue
- ROAS
- Pipeline
- Profit contribution
A strong forecast is not a guarantee. It is a decision-making model.
The best forecasts also show what happens when assumptions change. This lets teams prepare for both weaker and stronger outcomes.
Where in Search Ads 360 can you find forecasting?
In the current Search Ads 360 interface, forecasting is available through Plans under the campaign-management and planning workflow. Plans can project likely performance over a selected period using historical campaign and conversion data. The forecast can include metrics such as clicks or conversions, and available settings allow marketers to adjust assumptions and explore different scenarios.
Search Ads 360 also provides other forecasting-related tools, including bid strategy forecasted metrics, bid strategy recommendations, and Google Ads bid simulators.
Keep in mind that a native platform forecast is not the same as a complete business forecast. It can help estimate media performance, but your broader model should still account for customer quality, incrementality, margins, sales outcomes, and performance across other channels.
Conclusion
Paid media forecasting is not about finding one number that perfectly predicts the future.
It is about creating a model that remains useful when conditions change.
CPCs can rise. Conversion rates can fall. Creative can become less effective. Automated bidding can change delivery. Audiences can overlap. Additional spend can produce weaker marginal returns.
A strong forecasting system expects these problems.
Start with clean data. Forecast reach before efficiency, and efficiency before profitability. Use cohort analysis to understand customer behavior over time. Use blended CAC to evaluate the full acquisition system. Adjust for incrementality when attribution overstates paid impact. Use spend elasticity to understand what happens when budgets increase.
Then turn the model into an operating process.
Review forecast versus actual performance. Identify which assumptions changed. Update the model. Communicate the risk range clearly.
That is what makes a paid media forecast valuable.
It does not need to predict every result perfectly. It needs to help the business make better decisions before the money is spent—and respond faster when reality differs from the plan.
Read More: What Is Query Fan-Out and Why Do You Need It in Your Content Strategy


